Everything You Need to Know About MD Dashboard: Features, Benefits, and How to Get Started
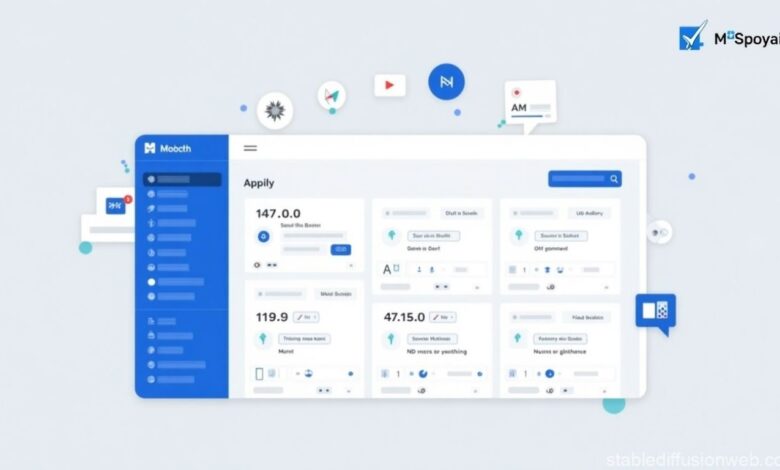
In today’s data-driven healthcare landscape, the MD Dashboard is emerging as an essential tool for physicians, healthcare managers, and hospital administrators. These dashboards consolidate key data into one view, enabling smarter decisions and improved patient outcomes. From reducing administrative burdens to tracking clinical performance in real-time, MD Dashboards are transforming the way healthcare professionals manage patient care.
What Is an MD Dashboard?
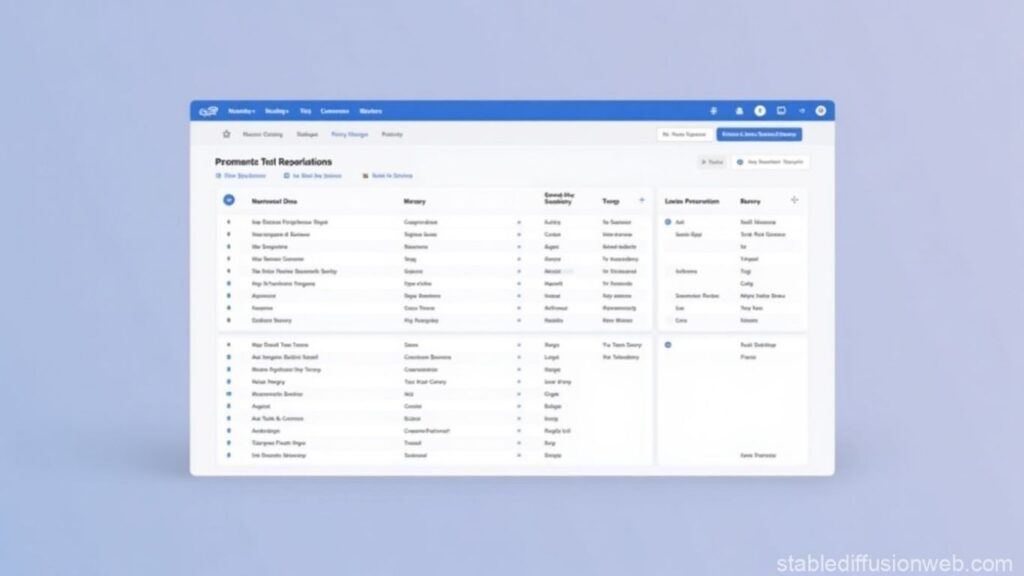
An MD Dashboard (Medical Doctor Dashboard) is a centralized digital interface that provides real-time insights into various healthcare metrics. It integrates data from electronic health records (EHRs), laboratory systems, radiology departments, billing software, and scheduling tools. By offering a comprehensive overview of patient health, provider performance, and hospital operations, it allows for faster decision-making and better care coordination.
An MD Dashboard can also be tailored to different roles in the healthcare environment. Physicians may focus on patient status and diagnostics, while hospital administrators might prioritize financial indicators and occupancy rates. This level of customization makes MD Dashboards both versatile and indispensable.
What is called a dashboard?
A dashboard is a data visualization interface that aggregates, organizes, and displays key information on a single screen. It allows users to monitor performance metrics, analyze operational data, and identify trends instantly.
In the healthcare setting, dashboards often go beyond static data. They incorporate interactive components such as alerts, filters, and graphs that respond to user input. This real-time interactivity supports dynamic decision-making and agile clinical responses.
Key Features of an MD Dashboard
Real-Time Data Monitoring
MD Dashboards are built to provide real-time monitoring of vital statistics and patient records. This includes instant updates on lab results, medication changes, or changes in a patient’s condition. The ability to react immediately to these changes can significantly reduce medical errors and response times.
In intensive care units (ICUs), for instance, dashboards track oxygen saturation, heart rate, and blood pressure continuously, alerting staff to any abnormalities. These real-time updates are critical for time-sensitive interventions.
Patient Information Management
Efficient data management is one of the core benefits of MD Dashboards. Medical professionals no longer have to search through fragmented systems to find patient histories, lab tests, or diagnostic images. With all patient data stored in one place, continuity of care becomes easier to maintain.
In addition, centralized data supports better handoffs between shifts, reducing the likelihood of information loss and medical oversights.
Customizable Widgets and Charts
Every healthcare facility has unique needs. MD Dashboards allow users to select and customize widgets to display data that is most relevant to their role. For example, a cardiologist may prefer to view ECG trends and medication adherence, while an ER doctor may focus on triage status and wait times.
Custom dashboards can also be configured for entire departments or teams, supporting more cohesive unit-level management.
Secure Access and HIPAA Compliance
Given the sensitivity of healthcare data, MD Dashboards are built with strict security measures. This includes encrypted data transmission, multi-factor authentication, and user-level access restrictions. Most reputable platforms follow HIPAA (Health Insurance Portability and Accountability Act) standards to protect patient privacy.
Audit logs and access history are often built-in to track user behavior and prevent unauthorized data manipulation or leakage.
What are dashboard items?
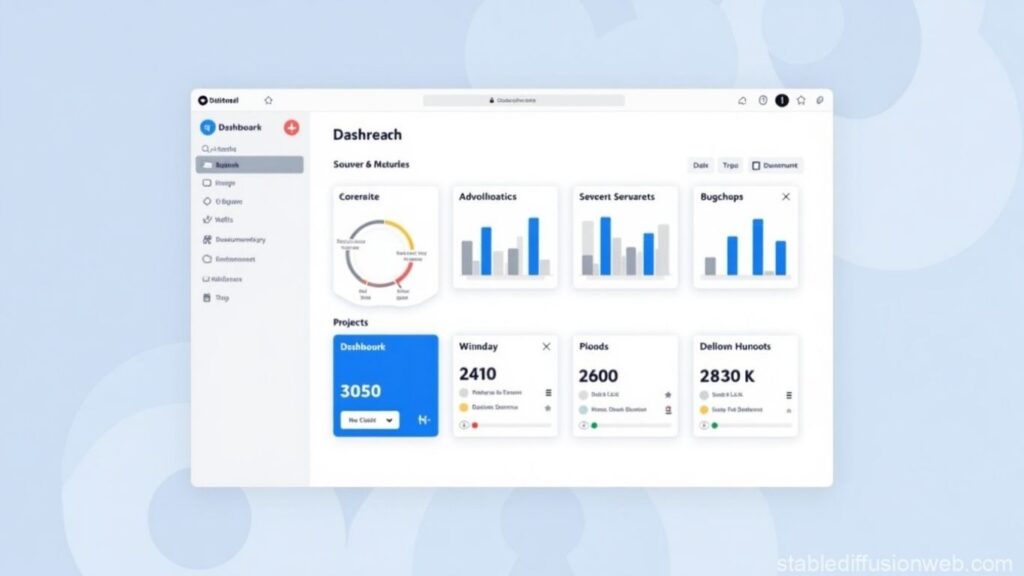
Dashboard items are the interactive elements that populate the dashboard interface. These include:
- Graphs and Charts: To visualize trends over time.
- KPIs (Key Performance Indicators): Highlight critical metrics like average discharge time or infection rates.
- Tables: For structured, detailed data presentation.
- Alerts and Notifications: Triggered when metrics fall outside of acceptable ranges.
- Filters and Search Bars: To narrow data views based on patient demographics, time ranges, or conditions.
These components work together to turn raw data into actionable insights.
Benefits of Using an MD Dashboard
Improved Patient Outcomes
The biggest advantage of an MD Dashboard is faster access to accurate data. With all relevant patient information visible at a glance, physicians can make quicker decisions, order timely tests, and initiate treatment without delays. This leads to better outcomes, especially in critical care and emergency settings.
Dashboards also support evidence-based care by highlighting guideline deviations or overdue screenings.
Enhanced Workflow Efficiency
By eliminating the need to log into multiple systems, MD Dashboards reduce administrative burden and improve staff efficiency. Healthcare professionals can spend more time with patients instead of managing paperwork or navigating various software.
Administrative teams also benefit by being able to track resources, staffing schedules, and appointment flows in real-time.
Data Visualization for Better Decisions
Complex datasets are simplified into easy-to-read visuals, allowing for faster interpretation and deeper understanding. Charts, heatmaps, and trend lines reveal patterns and anomalies that might be missed in raw tabular data.
Visualization tools are especially useful in boardroom or departmental meetings, where stakeholders need quick overviews of performance metrics.
Cross-Department Collaboration
MD Dashboards serve as a single source of truth that bridges communication gaps between departments. For example, when patient discharge is delayed due to pending lab results or a room availability issue, dashboards help all involved departments track and address the bottleneck collectively.
This leads to more coordinated care, reduced readmission rates, and improved patient satisfaction.
Why create dashboards?
Creating dashboards in healthcare is essential for monitoring real-time metrics, simplifying decision-making, and supporting strategic planning. Dashboards also reduce cognitive overload by presenting only relevant data points, helping clinicians avoid decision fatigue.
Furthermore, dashboards play a key role in compliance, as healthcare organizations can track regulatory KPIs and prepare for audits more efficiently.
Popular Platforms Offering MD Dashboard Solutions
- Epic Systems – One of the most widely used EHR platforms, Epic offers integrated dashboards with custom modules for specialties like oncology and cardiology.
- Cerner – Known for its intuitive, role-based dashboards that allow medical and administrative staff to visualize patient journeys and hospital performance.
- Tableau Healthcare – Delivers advanced analytics with high flexibility, allowing users to design tailored dashboards across departments.
- OpenMRS – Open-source and designed for global health, particularly useful in developing regions where resources are limited.
These platforms offer a variety of features, including cloud-based access, API integration, and real-time alerts.
How to Implement an MD Dashboard in Your Practice
Assessing Your Needs
Before implementation, conduct a thorough needs assessment. Identify the clinical, financial, and operational metrics that are critical for your practice. Decide which users will interact with the dashboard and define their data access needs.
Choosing the Right Dashboard Solution
Select a platform that integrates well with your existing systems. Evaluate user-friendliness, scalability, vendor support, and compliance with HIPAA and other regulatory standards. Request demos and consult with peer institutions before making a decision.
Training and Onboarding Staff
Staff engagement is crucial for successful implementation. Provide structured training and create user manuals or video tutorials. Early adopters or champions within the team can help onboard others and encourage widespread adoption.
Measuring ROI and Performance
Once the dashboard is live, continuously track metrics like reduced hospital stay, improved patient throughput, or better billing accuracy. Analyze usage logs to see how frequently the dashboard is being accessed and whether it’s achieving your initial goals.
Challenges and Considerations
- Data Security: Choose platforms with robust security frameworks, encryption standards, and regular audits.
- Integration Complexity: Older legacy systems might require APIs or middleware for seamless data flow.
- Staff Adoption: Resistance to new tools is common. Engage end-users in the development process and provide continued support post-launch.
These challenges can be mitigated with strong planning and stakeholder involvement.
Future of MD Dashboards

AI-Powered Predictive Analytics
The next generation of MD Dashboards will incorporate AI algorithms to predict patient deterioration, suggest treatments, and optimize hospital resource use. These smart dashboards will move from reactive to proactive care.
Mobile and Remote Access
Mobile-friendly dashboards will enable physicians and administrators to monitor operations on the go, improving flexibility and responsiveness. This is especially valuable during off-hours or in multi-site healthcare systems.
Cloud Integration
Cloud-based dashboards offer scalability, easier updates, and improved collaboration. As more healthcare organizations move to the cloud, expect dashboards to become more modular, customizable, and collaborative.
FAQs About MD Dashboards
What are the three types of dashboards?
- Operational dashboards – Monitor real-time data and performance.
- Strategic dashboards – Track long-term goals and KPIs.
- Analytical dashboards – Provide in-depth data analysis.
What is a dashboard portal?
A dashboard portal is a centralized platform that houses multiple dashboards for different departments or user roles.
What is my Google Dashboard?
Google Dashboard allows users to view and manage data associated with their Google account.
What is a dashboard, and example?
A dashboard is a visual interface showing key data. Example: A hospital dashboard showing current bed occupancy and patient wait times.
What is a KPI dashboard?
A KPI dashboard displays critical performance indicators such as patient satisfaction, readmission rates, and treatment outcomes.
What are the four elements of the dashboard?
- Data source
- Visualization tools
- User interface
- Interactivity filters
Which dashboard is useful for senior management?
Strategic dashboards are best for senior management, offering a high-level view of organizational performance.
What are the basics of dashboards?
Dashboards should be intuitive, real-time, secure, and customizable, focusing on actionable insights.
How many dashboards are there?
There are three main types: operational, strategic, and analytical, but many variations exist across industries.
What is an example of a good dashboard?
A good dashboard is user-friendly, provides real-time insights, and is customized to its users. Example: A dashboard that shows ER wait times, doctor availability, and patient satisfaction in one view.
What is a different dashboard?
Different dashboards serve different functions, such as marketing dashboards, financial dashboards, and healthcare dashboards.
What are the 3 layers of dashboards?
- Data Layer – Collects and stores data
- Logic Layer – Processes and analyzes data
- Presentation Layer – Visualizes the data
What are the different types of dashboard materials?
Dashboards can be built using platforms like Tableau, Power BI, Excel, or custom web applications.
What are KPIs and dashboards?
KPIs (Key Performance Indicators) are metrics that measure success; dashboards are tools to track and display them.
How would you classify a complex BO dashboard?
A complex BusinessObjects (BO) dashboard involves multiple data sources, advanced analytics, and user-driven customization.
Why is it called a dashboard?
It’s named after car dashboards, which provide drivers with essential information at a glance.
Which 3 types of actions can be launched from a pervasive dashboard?
- Drill-down analysis
- Alerts/notifications
- Data exports or reports
How do dashboards work?
They pull data from various sources, process it, and present it visually for easy decision-making.
What are dashboard-type reports?
These are interactive reports designed like dashboards, allowing users to filter and drill down into data.
What are the three types of consumers: dash, dash, and dash?
- Executives need strategic insights
- Managers – track operational performance
- Analysts – conduct deep data analysis
What is an analytics dashboard?
It focuses on trends and insights drawn from complex data sets to guide business or clinical decisions.
What are dashboards in project management?
They show project timelines, budgets, milestones, and team workloads in a consolidated view.
What is a dashboard in digital marketing?
A digital marketing dashboard tracks metrics such as traffic, conversion rates, and ROI across campaigns.
What are the three essential elements of a marketing dashboard?
- Campaign performance metrics
- Audience engagement
- Conversion tracking
What are most dashboards made of?
Most dashboards are built using data visualization platforms like Tableau, Power BI, or custom-coded interfaces.
What is the difference between a dashboard and a KPI?
A dashboard is a display tool; a KPI is a measurable value shown within that tool.
What are dashboards on Excel?
Excel dashboards are spreadsheets enhanced with charts, formulas, and macros to present key data points interactively.
What is the difference between strategic and operational reporting?
Strategic reports focus on long-term goals; operational reports deal with daily activities and performance.
What are the different types of dashboards in Dynamics 365?
- User dashboards – Personalized views
- System dashboards – Shared organizational data
- Interactive dashboards – For advanced filtering and real-time updates
What are the key differences between a dashboard and a chart table?
A chart shows one data metric visually; a dashboard compiles multiple charts and tables into one interface.
What is the difference between a dashboard and a dynamic dashboard?
Dynamic dashboards update based on user inputs or filters; standard dashboards display static data sets.
Who uses dashboards?
Executives, managers, clinicians, analysts, and administrative staff all use dashboards to inform decisions.
What are the three key aspects of designing a great dashboard?
- Clarity – Easy to understand
- Relevance – Shows only important data
- Interactivity – Allows user control and filtering
Conclusion
The MD Dashboard is a transformative tool that merges healthcare analytics with real-time visualization to enhance decision-making, streamline operations, and improve patient care. From customizable widgets and HIPAA compliance to AI-driven insights, an MD dashboard offers a dynamic, secure, and insightful experience for healthcare professionals at all levels.
As the healthcare industry continues to evolve, embracing tools like the MD Dashboard ensures that medical facilities remain efficient, patient-focused, and ready for the challenges of modern medicine.
MORE ARTICLES Buzznewsdaily

